


Finish your profile right here and directions for adding your Profile Picture (which appears when you post) is right here.
NJDuck
-
Joined
-
Last visited
Posts posted by NJDuck
-
-
Report: ESPN could pull $7.8 billion media rights offer if College Football Playoff doesn't resolve 12-team format
-
 1
1
-
-
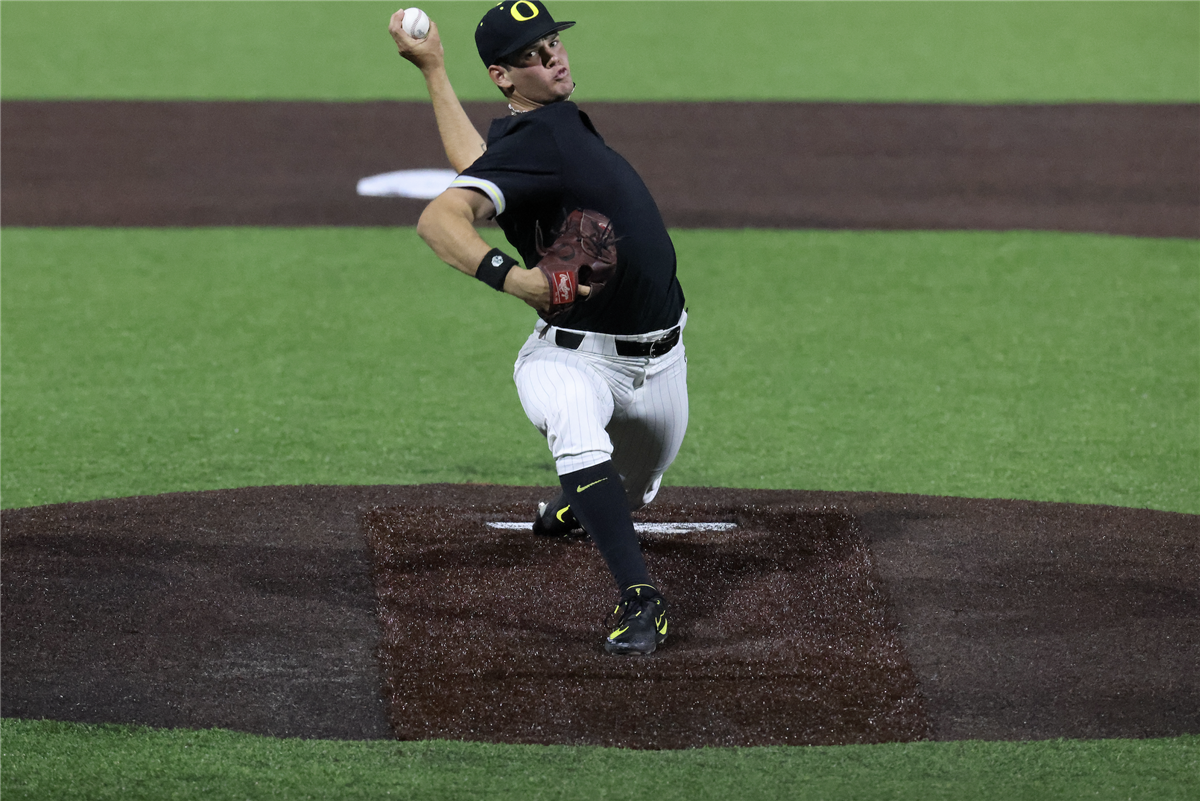
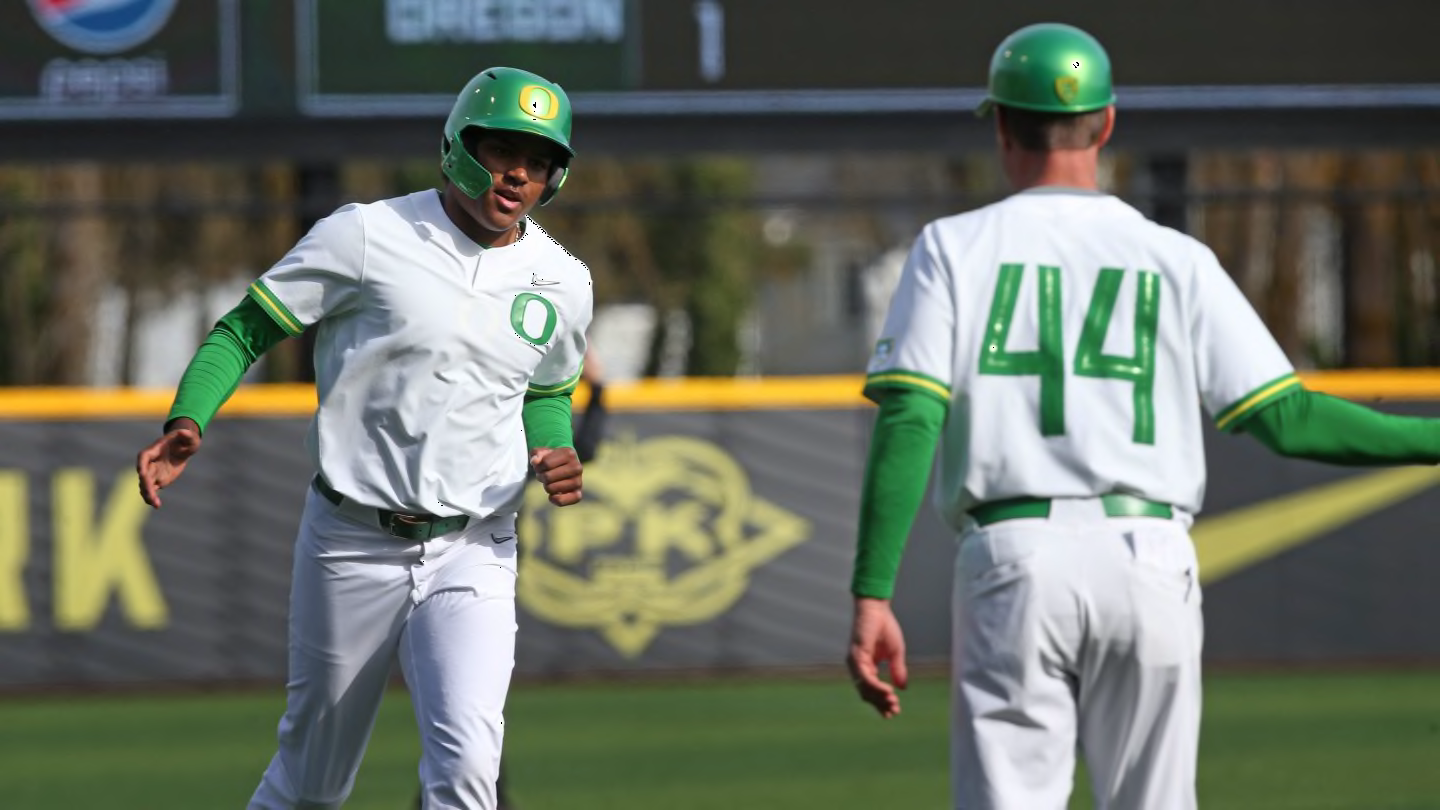
Pitching leads the way for Oregon's opening-day victory over Oklahoma
Oregon opens the season 1-0 after a two-run victory over Oklahoma.
 Pitching leads the way for Oregon's opening-day victory over Oklahoma
247SPORTS.COM
Pitching leads the way for Oregon's opening-day victory over Oklahoma
247SPORTS.COM
Oregon opens the season 1-0 after a two-run victory over Oklahoma. -
-
 1
1
-
 1
1
-
-
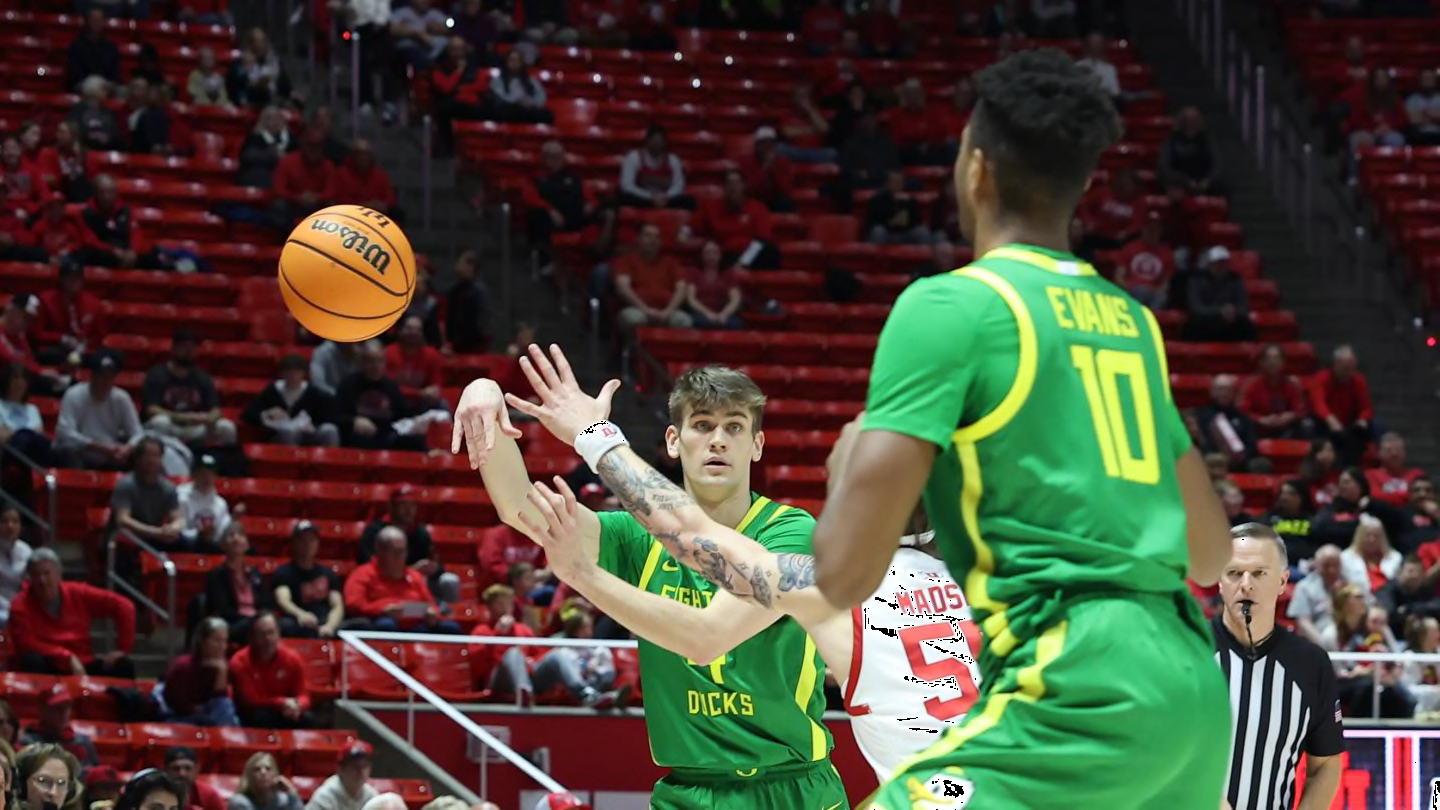
Bracketology Update: Oregon's hopes at March Madness are on life support

 Oregon Basketball: Ducks’ hopes at March Madness are dwindling
DUCKSWIRE.USATODAY.COM
Oregon Basketball: Ducks’ hopes at March Madness are dwindling
DUCKSWIRE.USATODAY.COM
After a hot start to the Pac-12 season, the Oregon Ducks have gone ice cold, dropping them out of NCAA tournament contention. -
Oregon men's basketball penultimate Pac-12 Civil War: How to watch, injuries, more
Oregon men's basketball penultimate Pac-12 Civil War: How to watch, injuries, more
AUTZENZOO.COM
The long-lived West Coast rivalry between Oregon and Oregon State is quickly coming to an end. Here's how to watch the upcoming matchup. -
-
OREGON DUCKS

LB Nasir Wyatt — “I was close to [entering a Crystal Ball pick] before the trip even started, but I really like Nasir Wyatt to Oregon. I think they’re doing a great job, so I’m going to join Greg Biggins, Steve Wiltfong and Brandon Huffman with that one. I like the Ducks to get it done. He even said that they’re doing the best job with him. He wants to take visits. Ohio State, Tennessee, Michigan, a couple others are also in play, but I really like Oregon to get that one done.”
S Jadyn Hudson — “I think the Ducks are going to get that one done and get that commitment. Ohio State, Tennessee are the other top contenders. But again, for him especially, the stability of the coaching staff, then also distance and just his overall connection with that coaching staff, I really think that’s why Oregon is the team to beat. I’m also not ruling out USC. If they really start to push and do a better job with him, there is a possibility the Trojans could get back in play.”
WR Derek Meadows — “He mentioned Oregon, Notre Dame, Bama, Florida. I like Notre Dame right now, but Oregon is absolutely a team to watch. They just offered.”
WR Cooper Perry — “I like Oregon. That’s where my Crystal Ball is at. Watch out for Oklahoma. He just visited there.”
S Faheem Delane — “Oregon, once again, first team he mentioned. But I do think Ohio State is the team to watch right now, but the Ducks are definitely in play.”
WR Isaiah Mozee — “Also mentioned Oregon. You can see a theme here. Nebraska, Tennessee and Missouri also in play, but Oregon, in my opinion, is the team to beat. Very tempted to put a Crystal Ball pick on the Ducks.”
IOL Seuseu Alofaituli — “Oregon, Miami, a couple others in play.”
CB DJ Pickett — “Oregon’s a real, real threat that isn’t getting talked about enough. I’m watching them and Miami closely.”
S Trey McNutt — “I think Ohio State’s probably the team to watch, but don’t be surprised if the Ducks land him.”
 College football recruiting: Miami, Oregon receive Crystal Ball predictions after Nike's 'The Next Ones' event
247SPORTS.COM
College football recruiting: Miami, Oregon receive Crystal Ball predictions after Nike's 'The Next Ones' event
247SPORTS.COM
The Hurricanes and Ducks are not the only teams making progress. -
Oregon Football under Dan Lanning needs to make the most of 2024 | Oregon Ducks Podcast
For the first time since the 2011-12 seasons, Oregon has coaching staff continuity at the 3 biggest positions (HC, OC, DC). Will that be the case after the 2024 season? On today's episode of Locked On Ducks, Spencer McLaughlin is joined by Erik Skopil of 247Sports and the 'Autzen Audibles' podcast. He shares his thoughts on Oregon's offseason moves and who he expects to make the biggest impact.
Spencer and Erik also talk about Oregon Men's Basketball under Dana Altman ahead of Saturday's game against Oregon State. Can they actually make the necessary stretch run to make the NCAA Tournament?
-
House Bill 4119 would prohibit the NCAA, conferences and other athletics governing bodies from punishing athletes or schools due to actual or alleged violations of the governing body’s NIL rules. It also would allow NIL compensation to be contingent on an athlete attending a specific school, plus provide colleges and universities in the state and their employees with liability protections related to NIL activity.
The bill passed 50-4 on Thursday and is scheduled for a first reading in the Senate on Monday
.
 Oregon House passes bill to stop NCAA from punishing schools, athletes for NIL activity
WWW.OREGONLIVE.COM
Oregon House passes bill to stop NCAA from punishing schools, athletes for NIL activity
WWW.OREGONLIVE.COM
House Bill 4119 passed in a vote of 50-4 on Thursday and is scheduled for a first reading in the Senate on Monday. -
-
-
All about the Ohio State Buckeyes:
Few schools in the country boast a richer football tradition than Ohio State, a powerhouse by every metric in the sport and a constant national contender. Defined by their own success on the field and an historic rivalry with fellow perennial contender Michigan, the Buckeyes are a globally recognized sports brand.
A winning tradition extends to other sports, too, but fans of the Oregon Ducks certainly have that Oct. 12 football game at Autzen Stadium circled on their calendars several times over. Especially now that former Oregon coach Chip Kelly will be Ohio State’s offensive coordinator.As the Ducks prepare for a move to the Big Ten Conference in 2024, The Oregonian/OregonLive is taking a look at all of their newest conference rivals. While Ducks fans might be deeply familiar with fellow Pac-12 departees Washington, USC and UCLA, they have 14 new teams to get to know this year.Next up is Ohio State. All about the Ohio State Buckeyes: An Oregon Ducks fan guide to the Big Ten Conference
WWW.OREGONLIVE.COM
All about the Ohio State Buckeyes: An Oregon Ducks fan guide to the Big Ten Conference
WWW.OREGONLIVE.COM
Few schools in the country boast a richer football tradition than Ohio State, a powerhouse by every metric in the sport and a constant national contender. -
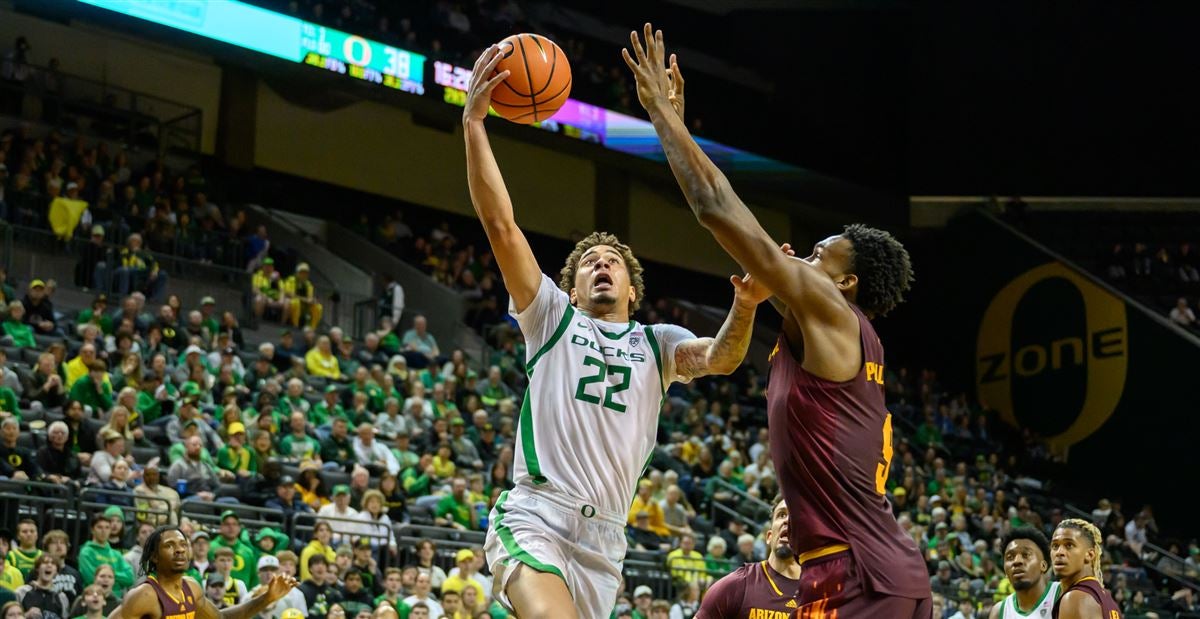
Oregon looking to build itself back up with a limited roster for its stretch run into March
The Ducks are working on building themselves back up with a limited bench as they try to save their season's postseason chances.
 Oregon looking to build itself back up with a limited roster for its stretch run into March
247SPORTS.COM
Oregon looking to build itself back up with a limited roster for its stretch run into March
247SPORTS.COM
The Ducks are working on building themselves back up with a limited bench as they try to save their season's postseason chances. -
More Oregon sports news:
The University of Oregon is known for its affiliation with Nike and its endless supply of uniforms. The football team hardly ever repeats a uni combo and the basketball teams seem to get a new shoe for every game.
However, this time around, it’s the baseball team getting to don new threads. With modernized fonts, new detailing, and crisp colors, the Ducks will look the part throughout their 2024 season.
-
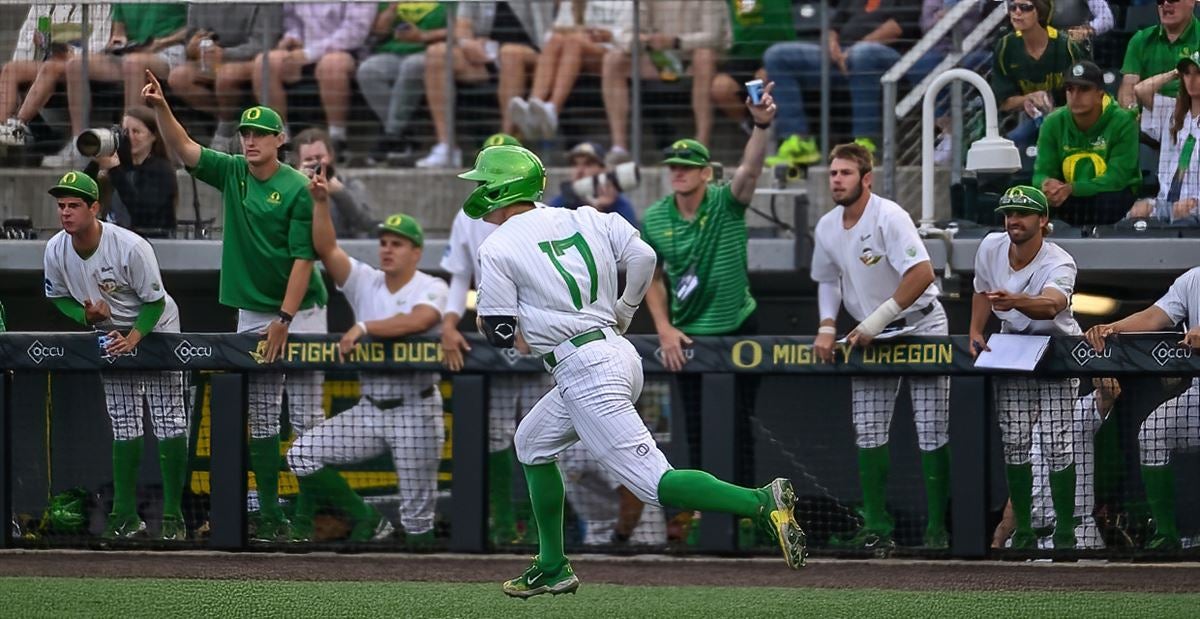
Mark Wasikowski set to start fourth season with Oregon baseball
Oregon baseball head coach Mark Wasikowski is about to kick off his fourth season with the Ducks. On Feb. 16, Oregon will head to Arlington, Texas to start its season at the Shriners Children’s College Showdown.
Despite being left out of the AP Top 25 Poll, I expect the Ducks to have an incredibly successful season and that will begin in the great state of Texas.
Three players on Wasikowski’s roster were named to the preseason All-Pac-12 Team; Grayson Grinsell, Logan Mercado, and Jacob Walsh were each named to the team to highlight Oregon’s stellar roster.
They are scheduled to play Oklahoma, Baylor, and No. 18 Texas Tech over the weekend.
 AUTZENZOO.COM
On Feb. 16, Oregon will head to Arlington, Texas to start its season at the Shriners Children’s College Showdown. -
Follow along for live updates between Oregon and Baylor in game two of the Shriners Children's College Showdown
 Live baseball updates: Oregon takes on Baylor in game two of the Shriners Children's College Showdown
247SPORTS.COM
Live baseball updates: Oregon takes on Baylor in game two of the Shriners Children's College Showdown
247SPORTS.COM
Follow along for live updates between Oregon and Baylor in game two of the Shriners Children's College Showdown.-
 1
1
-
-
PODCAST: College football reporter Matt Zenitz helps break down Oregon's offseason
Oregon 2024 Recruiting Class Superlatives
On this edition of the Autzen Audibles Podcast, Erik Skopil is joined by 247Sports college football reporter Matt Zenitz. The pair discuss Oregon's offseason, and specifically what stood out from the portal additions, how those were made and where the Ducks stand entering their first season in the Big 10 conference in 2024.
All that and much more is included in this podcast edition!
 PODCAST: College football reporter Matt Zenitz helps break down Oregon's offseason
247SPORTS.COM
PODCAST: College football reporter Matt Zenitz helps break down Oregon's offseason
247SPORTS.COM
Oregon 2024 Recruiting Class Superlatives -
Oregon men’s basketball center Nate Bittle undergoing tests for illness, will not play vs. Oregon State
 Oregon center Nate Bittle undergoing tests for illness, will not play vs. Oregon State
WWW.OREGONLIVE.COM
Oregon center Nate Bittle undergoing tests for illness, will not play vs. Oregon State
WWW.OREGONLIVE.COM
Ducks coach Dana Altman said Bittle has more tests to determine the illness that has sidelined the 7-foot junior for the last four games -
Is Oregon the Team to Beat for Another Blue-Chip Defensive Back?
Max Torres spotlights 2025 Pittsburg (Calif.) safety Jadyn Hudson. Hudson is ranked inside the top-100 players nationally and is an Adidas All-American selection ahead of his senior season. Oregon has numerous ties in this recruitment and recently picked up a 247Sports crystal ball prediction to land Hudson. They're positioned well in this recruitment and could very well be the team to beat.
-
Recapping the 2023 snap counts of returning Duck offensive players
With several players set to take a step up in responsibility in 2024, we take a look back at how much each returning player saw the field during the 2023 season.
 Recapping the 2023 snap counts of returning Duck offensive players
247SPORTS.COM
Recapping the 2023 snap counts of returning Duck offensive players
247SPORTS.COM
With several players set to take a step up in responsibility in 2024, we take a look back at how much each returning player saw the field during the 2023 season.-
1
-
-
On 2/15/2024 at 2:27 PM, Jon Joseph said:
Great take but who would you replace Day with? Especially after he convinced all draft-eligible players with eligibility left, except for Harrison to come back. Finished No. 5 in recruiting, did a great job with the transfer portal, and IMO caught a break with O'Brien headed to BC and Chip coming in to run the offense.
Quite frankly if I was Ohio St. I would keep Day. His win/loss record is very good, especially what he's accomplished through recruiting/transfer and obtaining Chip Kelly as the OC. Seems to me he's correcting issues going into the 2024 season. I am not convinced Chip is washed up (I guess will find out this coming season). He has a perfect ideal situation at Ohio St.
Day lost to an experience Michigan team who went undefeated, won the national championship with 18 players invited to the combine.
-
1
-
-
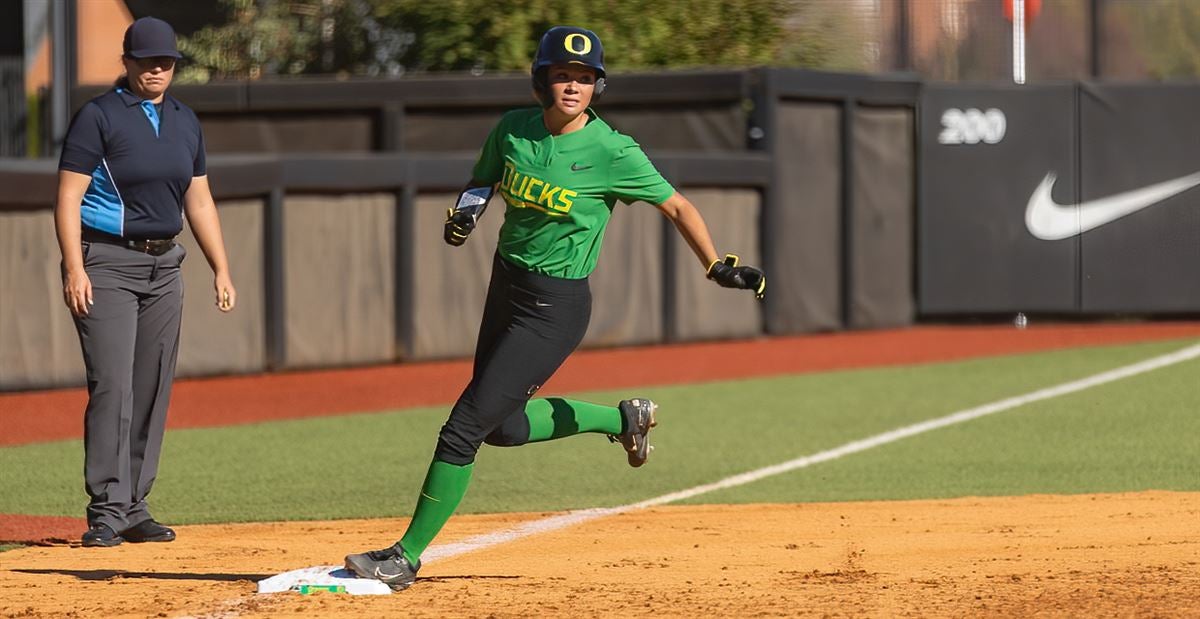
Oregon softball heading to San Diego for five games at the Campbell/Cartier Classic
The fourteenth Ducks (4-2) will play five games at the Campbell/Cartier Classic in San Diego this weekend beginning with games on Friday.
 Oregon softball heading to San Diego for five games at the Campbell/Cartier Classic
247SPORTS.COM
Oregon softball heading to San Diego for five games at the Campbell/Cartier Classic
247SPORTS.COM
The fourteenth Ducks (4-2) will play five games at the Campbell/Cartier Classic in San Diego this weekend beginning with games on Friday. -
247Sports: FOOTBALL RECRUITING PODCAST - Today at 4:30pm CT

 Football Recruiting Podcast: Crystal Ball Picks 🔮 | Michigan’s Record-Breaking NFL Scouting Combine
T.CO
Football Recruiting Podcast: Crystal Ball Picks 🔮 | Michigan’s Record-Breaking NFL Scouting Combine
T.CO
On this episode of The Football Recruiting Podcast with 247Sports Director of Scouting Andrew Ivins and 247Sports National Recruiting Analyst Cooper Petagna,... -
When an industry evolves, it typically does so slowly.
Along the way, there are signs that something is on the horizon—morsels of moments that ultimately add up over time. These moments can be small when individualized. But in totality, they can change everything.
In business, these moments start small and grow big. Eventually they become a trend, and eventually that trend becomes the norm. Suddenly, the business that is college football finds itself in a series of trends, although no trend is more curious than the sudden abundance of coaches leaving for other opportunities.
Given the impact of the transfer portal and the way NIL has brought free agency to the sport in a matter of years, that statement might sound strange. But it's the coaches operating in this universe that know it best, and many of these coaches are choosing to leave when given an opportunity to do so.
Currently, the sport is operating without guidance. Rules are iffy (at best). Rosters are being built with checkbooks and booster backing, first and foremost. The landscape is unknown, and the work required to build winners is greater than it has ever been.
The new requirements demanded of coaches at the college level are both extreme and still relatively unknown. Those who have found work at other levels are telling us, without actually saying it out loud, that the current climate is reaching an unsustainable place.
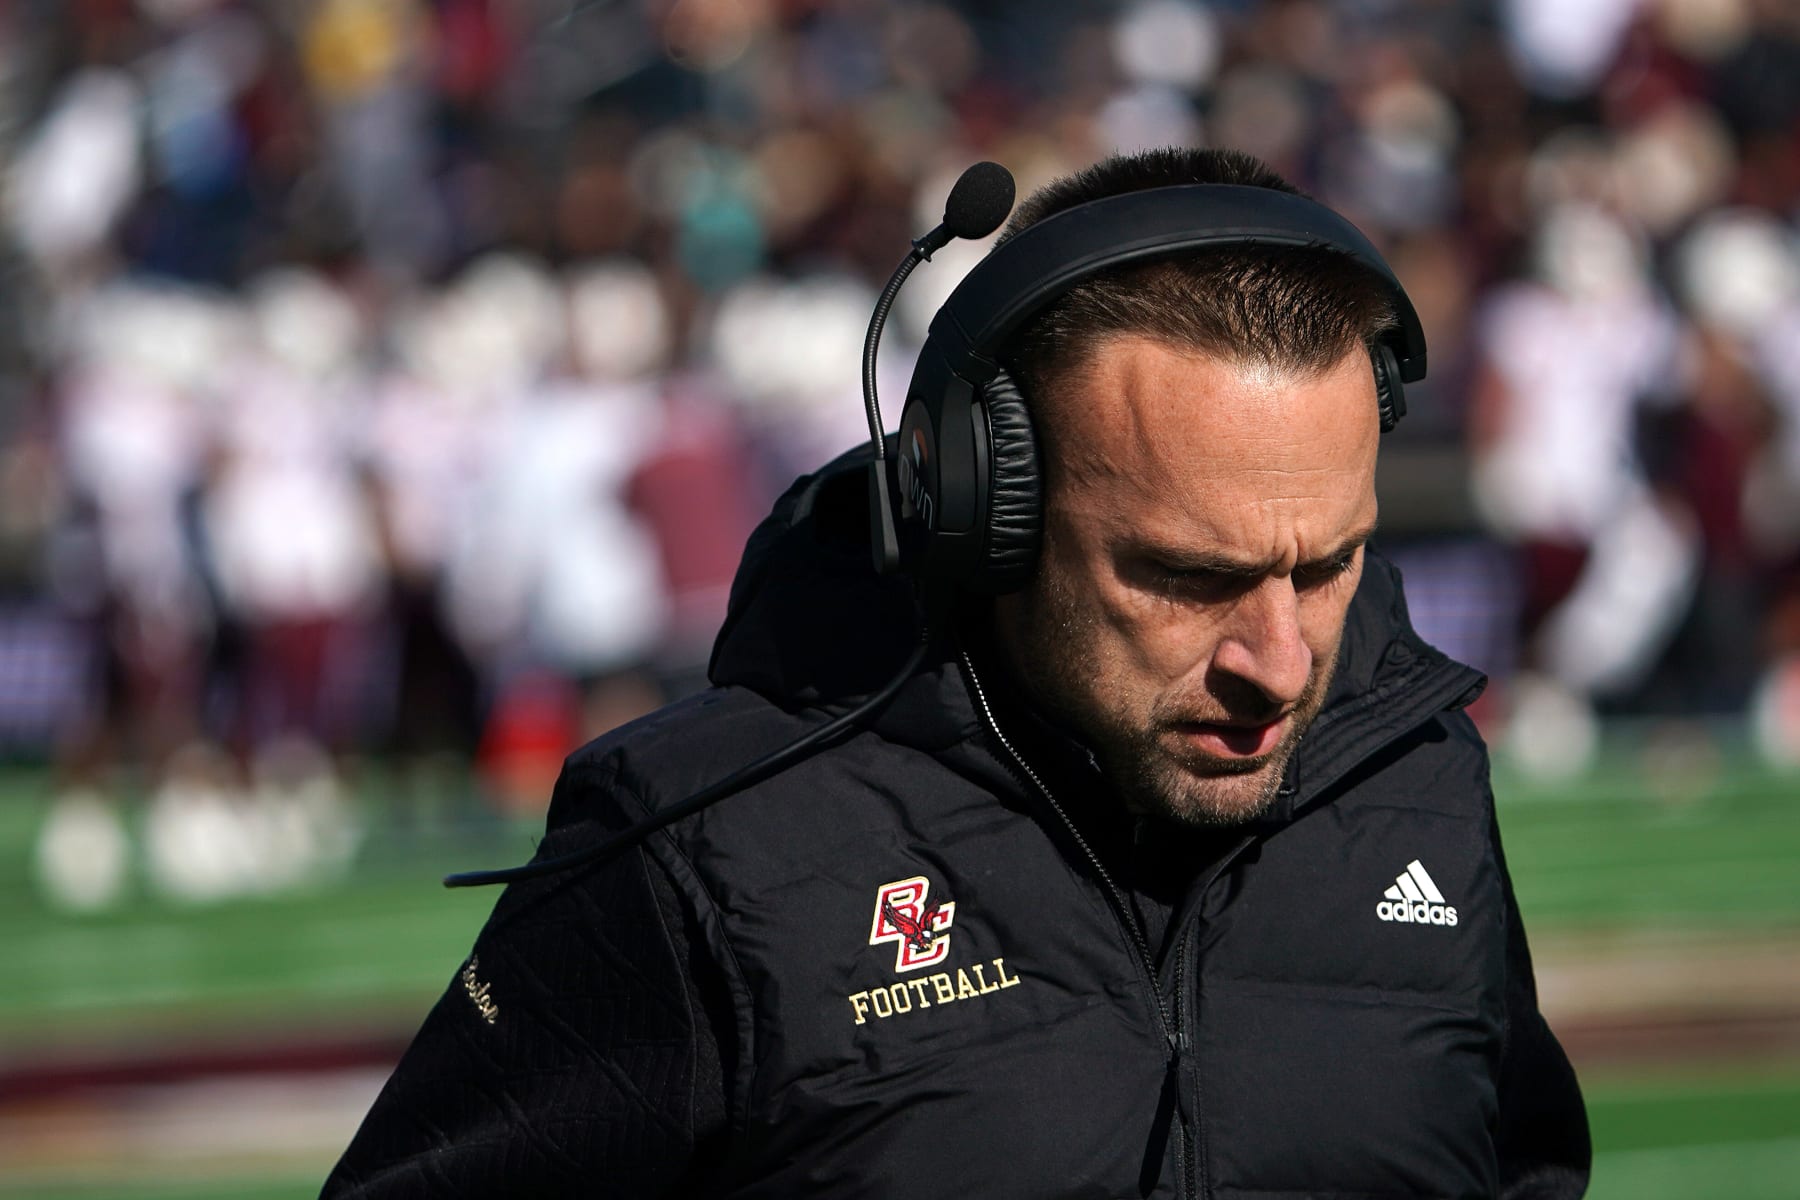
 Is College Football's Great Coaching Exodus Finally Here?
BLEACHERREPORT.COM
Is College Football's Great Coaching Exodus Finally Here?
BLEACHERREPORT.COM
When an industry evolves, it typically does so slowly. Along the way, there are signs that something is on the horizon—morsels of moments that ultimately add…-
 1
1
-
2026 Recruitment, Announcements, Interviews, Etc.
in Our Beloved Ducks
Ducks offer highly touted west coast OT in 2026 class
Oregon made a big-time offer to 2026 four-star OT Samuelu Utu.